Mandelbrot Visualization in Go
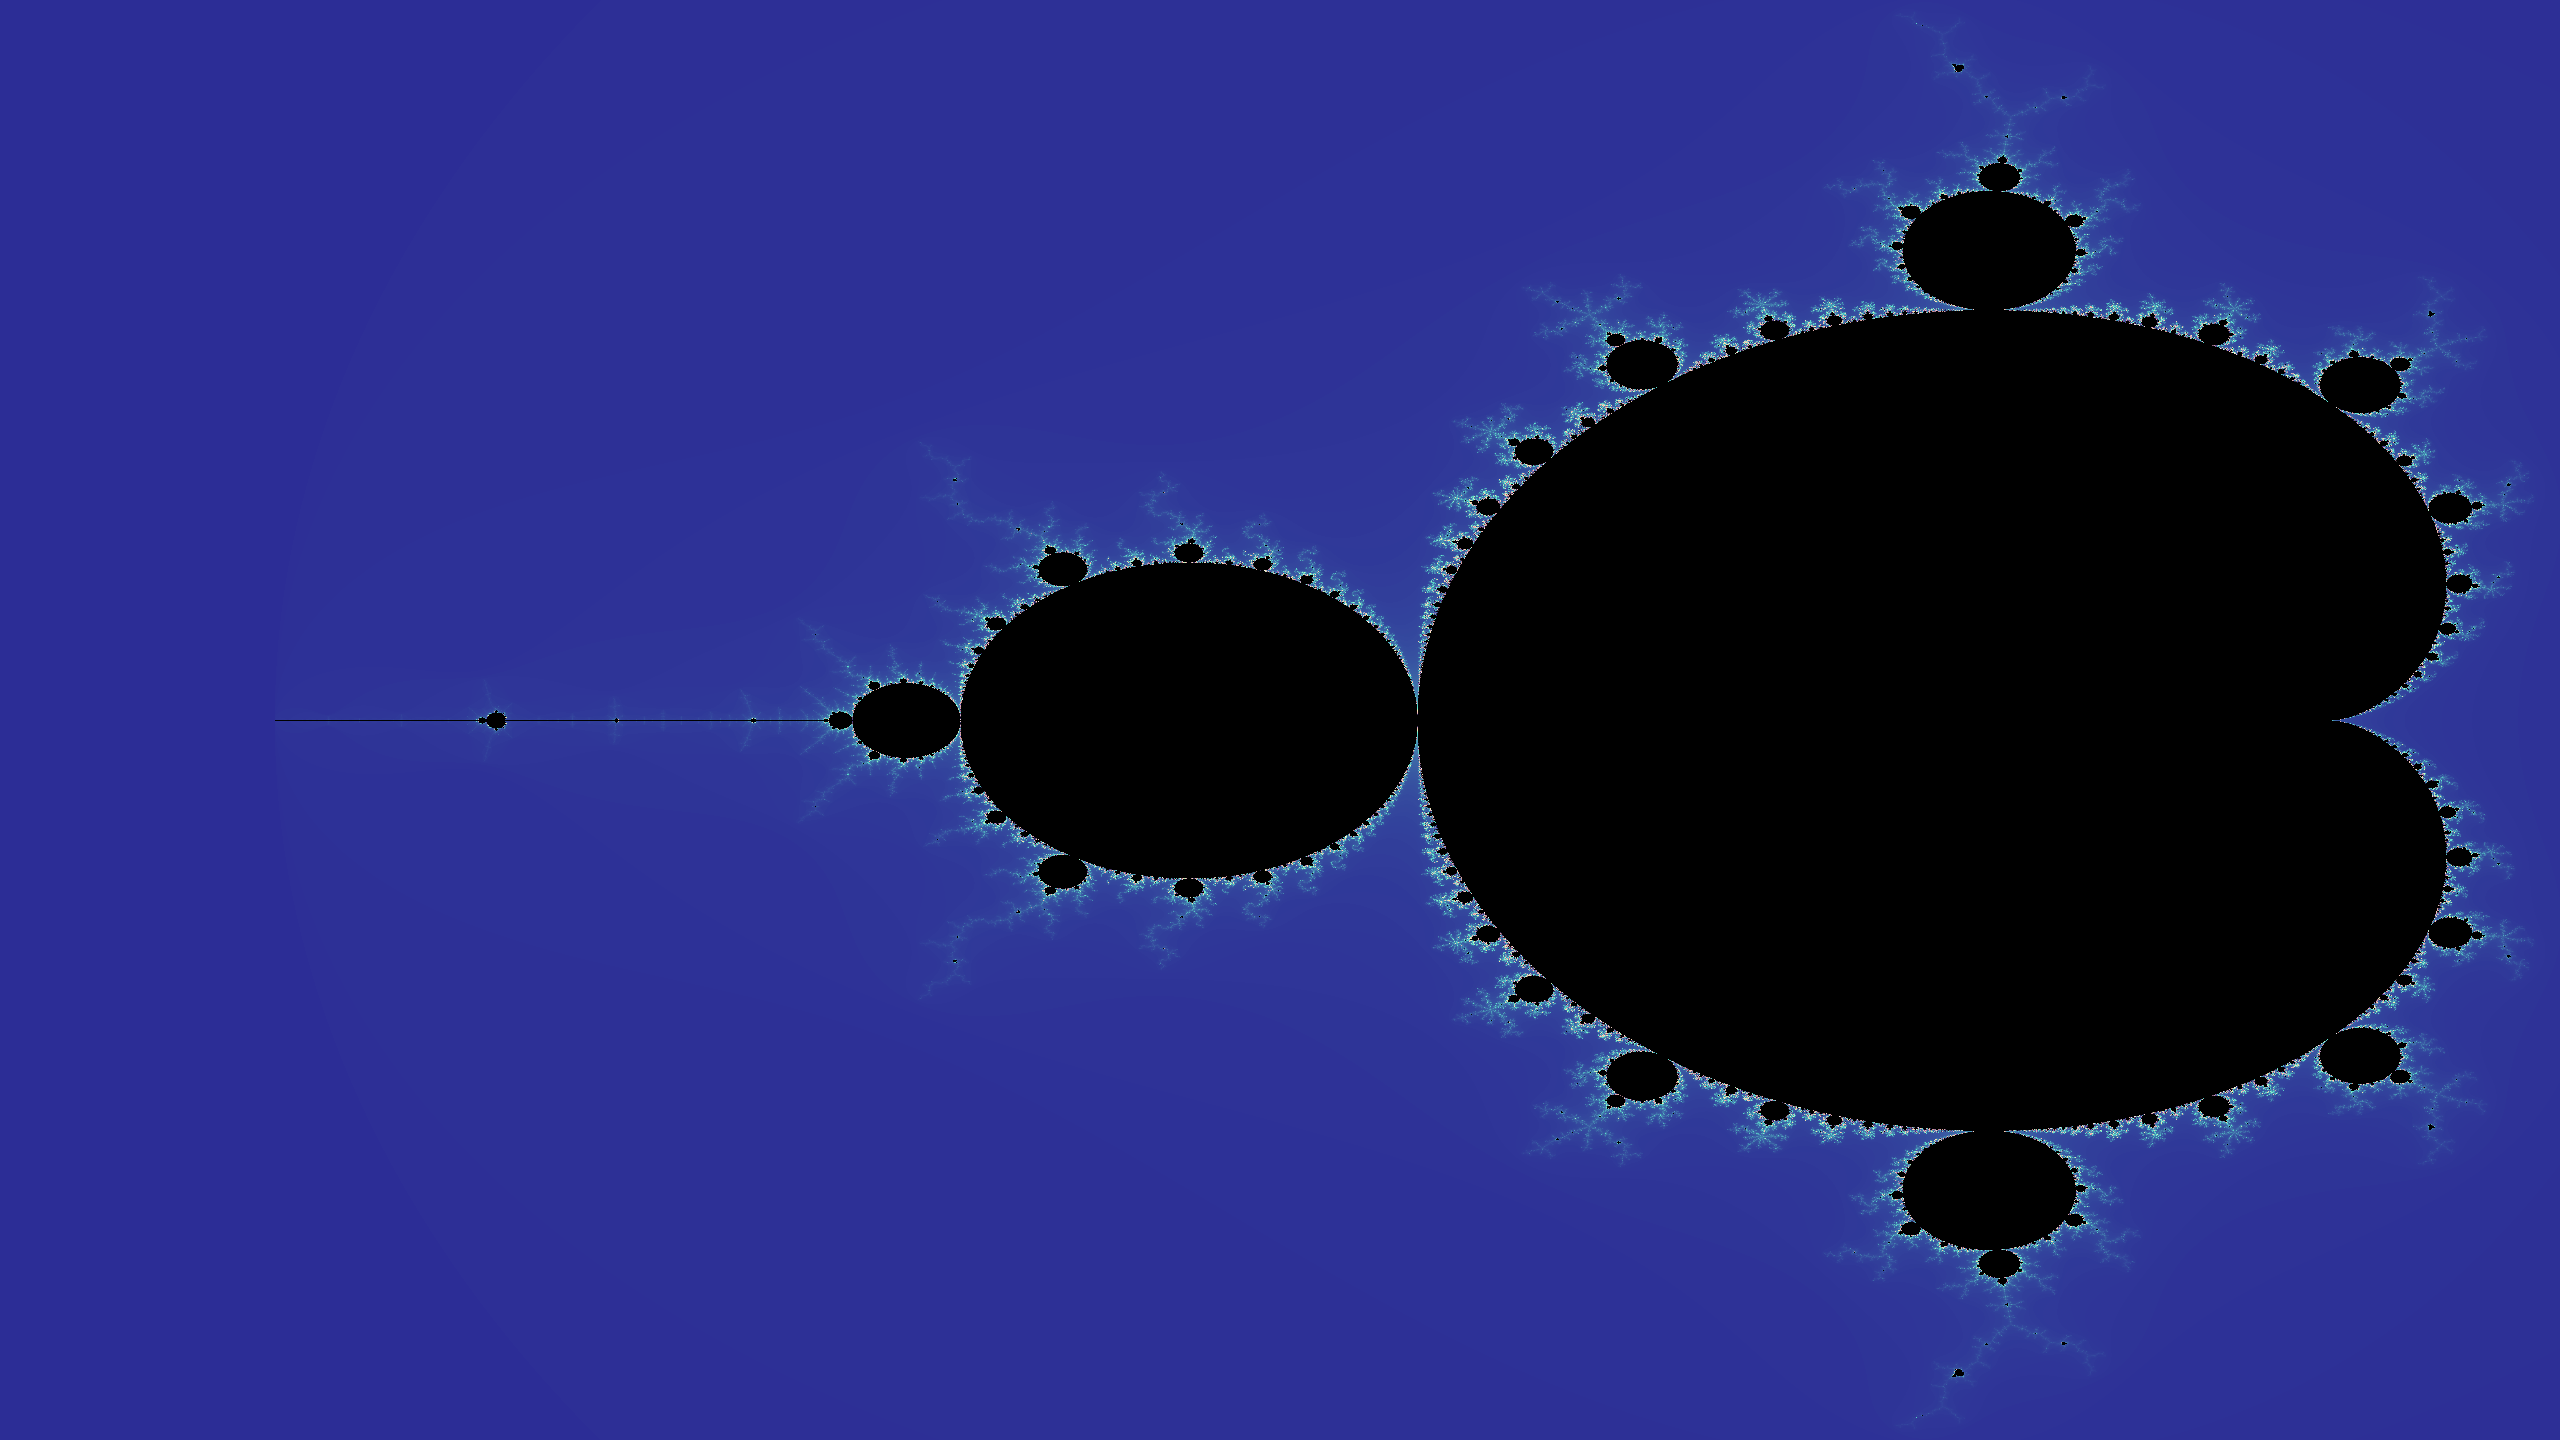
You’ve probably seen the visualization below, but if not, it’s called the Mandelbrot set1. Generally, this is referred to as a fractal, which is a geometric structure that contains detail at arbitrary scales.
I won’t write too much about this as there are already many wonderful resources on the topic2. The focus of this post is more about visualization using bare-bones Go. Without pulling in a third-party dependency, or even having to define a complex number type, you are able to implement a full video sequence zooming in on the Mandelbrot set!
As a primer, the Mandelbrot set is defined in the complex plane. The set is defined for some complex number, , for which the following does not diverge to infinity when iterated (starting at ):
It is also known that the set is bounded by an absolute value of (Specifically, the complex number with the largest magnitude in the set is ).
So, for the visualization, set c to each coordinate3 in the image and
iterate (up until a hand-picked maximum) to determine whether the point is in
the set. If at any point the magnitude of the complex number is greater than
, you can stop iterating. We can actually scale the iteration count to a
value between zero and one to indicate how quickly it shoots off to infinity.
Zero means almost immediately, and one means it’s likely within the set. Here’s
the entire snippet for calculating this ratio for a given pixel:
// In the source, you'll see that this scales based on the
// zoom factor, but it's otherwise the same idea.
c := complex(
  scale(float64(x)/float64(WIDTH), -2.3, 0.5),
  scale(float64(y)/float64(HEIGHT), -1.14, 1.14),
)


z := complex(0, 0)
var steps int
for steps = range MAX_STEPS {
  if cmplx.Abs(z) > 2 {
    break
  }
  z = z*z + c
}

intensity := (float64(steps) / float64(MAX_STEPS-1))
Go is not my personal first choice for most projects, but the standard library
really supports the freedom of demoing visualizations like this. Within Go, you
have image/png and math/complex (and the associated packages) which is
enough to iterate on the Mandelbrot set and render out a PNG sequence. From
there, you can use something like FFmpeg to render the sequence to video. In my
case, I used the following settings:
ffmpeg -i out/mandelbrot-%03d.png \
       -framerate 25 \
       -c:v libx264 \
       -pix_fmt yuv420p \
       -vf scale=1280:-1 \
       out/output.mp4
With that, you arrive at the following:
You’ll notice the video has more color-banding. This is simply because I rendered the images with fewer iterations. Increasing the iteration count reduces the banding.
Links
Footnotes
-
Such as: https://acko.net/blog/how-to-fold-a-julia-fractal/ ↩
-
Specifically, coordinates of the image scaled to the range of the Mandelbrot set (which is within the absolute range of 2 in both directions). ↩